SANER-2020
Website for the research paper “On Relating Technical, Social Factors, and the Introduction of Bugs”, submitted to the 27th IEEE International Conference on Software Analysis, Evolution and Reengineering (SANER 2020).
In this repository you will find the source code used to: (i) run the SZZ algorithm; (ii) collect all the data used; (iii) compute the metrics; and (iv) perform the statistical analyses. In this repository you will also find the data we collected and used in our analyses. Moreover, we provide some examples on how the analyses were conducted and a deeper characterization of the data collected.
To see the files in the repository, click on the “View on GitHub” button at the top of this page, or click on this link.
Methodology Example
To better understand the methodology of our study, we provide a real example. Let’s consider the commit #3cd54fc4 authored by the developer martijnvg on 13 September, 2012 in the Elasticsearch project. After analyzing this commit, we observed that most of the commit changes are related to the introduction of tests and reengineering of the source code to improve conditionals. In particular, the commit #3cd54fc4 involved 11 files, 313 additions, and 111 deletions.
A few days later, the developer martijnvg noted that he introduced a bug through his commit #3cd54fc4. He reported the bug in the issue #2297. After reporting the bug (issue #2297), the same developer fixed it by submitting the commit #51e69e1.
In our study, we use the commit #51e69e1, which fixed the bug, as an input to the SZZ algorithm. Then, SZZ returns the changes that introduced the bug. In this case, SZZ guessed right and the bug-introducing change was performed in #3cd54fc4. Then, we label #3cd54fc4 as buggy = true. The commits that were not reported by SZZ as a bug-introducing change are label as buggy = false.
Based on a project’s commits, we calculate the metrics described in the Section 2 of the paper. After this process, the metrics for each project should look like this:
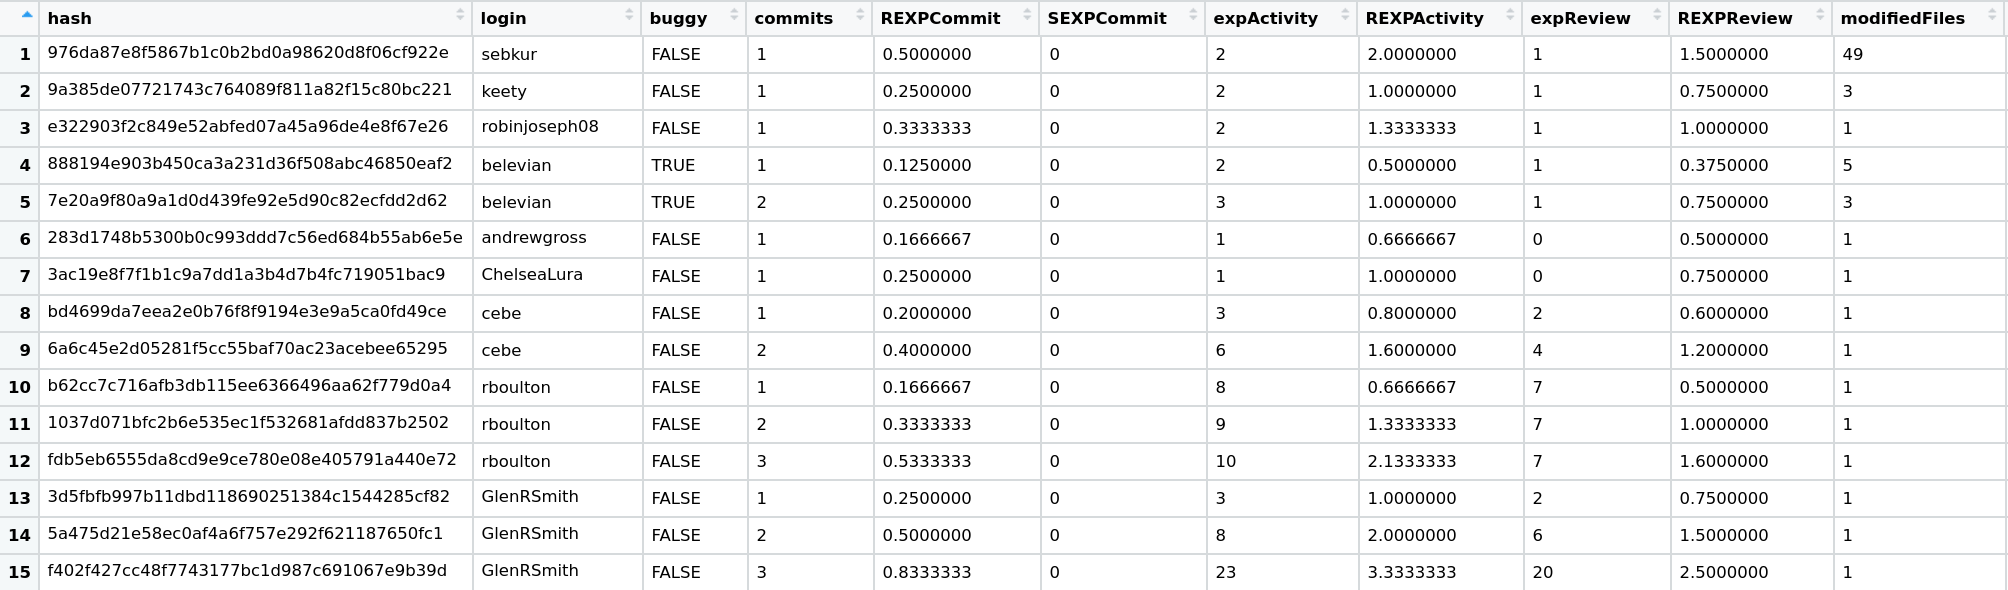
Finally, we use these metrics to perform the analysis on RQ1 and RQ2. For RQ1, we divide the values of a metric in two populations by the buggy attribute. Then, we perform the Wilcoxon Test and the Cliff’s Delta analyses based on these two populations. For RQ2, we set the metrics as predictors in a multiple logistic regression model and the buggy attribute as the response variable.
SZZ validation
We conducted a careful manual validation on a sample of 922 bug-introducing changes reported by SZZ. This sample presents a margin of error of 4% at a confidence level of 99%. Four pairs of researchers (familiar with the SZZ algorithm) from our research lab validated this sample. Each pair was responsible for a fraction of the sample, and each individual validated the same candidate bug-introducing changes. To take into account possible subjectivity during the validation, the researchers classified each candidate into four levels of certainty: “low”, “moderate”, “high”, and “absolute”. The levels are described below:
- Absolute: “I am sure this point introduced the bug”;
- High: “There is a strong suspicion that this point introduced the bug, although the root cause was not found”;
- Moderate: “There are reasonable chances that this point introduced the bug”;
- Low: “There is a distant (or missing) possibility that this point introduced the bug”.
In the cases the researchers of a pair classified a candidate very differently (e.g., “low” and “absolute”), one of the authors solved the conflict. After the validation procedure, we obtained an accuracy of 65% for our SZZ implementation.
The SZZ validation is available on this link.
Data collected
The files containing the computed metrics and the bug reports collected are hosted in this link. We also provide a deeper characterization of our data: (i) density plots for each metric on each project are available in the “plots” directory; and (ii) details on the data for each project are available in the table below.
| Project | Commits | Clean commits | Buggy commits | Buggy percentage | Developers |
|---|---|---|---|---|---|
| Bazel | 15,312 | 14,831 | 481 | 3,24% | 329 |
| Elasticsearch | 30,069 | 24,298 | 5,771 | 23,75% | 985 |
| Netty | 7,478 | 6,249 | 1,229 | 19,66% | 319 |
| OkHttp | 3,071 | 2,725 | 346 | 12,69% | 156 |
| Presto | 12,778 | 12,283 | 495 | 4,02% | 214 |
| RxJava | 4,987 | 4,737 | 250 | 5,27% | 197 |
| Signal-Android | 3,420 | 3,110 | 310 | 9,96% | 168 |
| Spring-boot | 15,254 | 14,232 | 1,022 | 7,18% | 441 |
Java source to run the SZZ algorithm
The Java source code used to run the SZZ algorithm is available in the “szz” directory. This source requires the usage of Java 8. To run it, do:
Usage: <main class> [options]
  Options:
    --input
      The path to the input bug reports directory
      Default: <empty string>
    --output
      The path to the output bug-introducing changes directory
      Default: <empty string>
    --repository
      The path to the repository
      Default: <empty string>
    --help
      Show the usage of the program
    --url
      The url of the Git repository to clone, i.e.,
      https://github.com/square/okhttp.git
      Default: <empty string>
The input bug reports directory should contain Json files following the pattern of the ones stored in this link. The output directory will be created if not existent. The repository path should lead to a valid git repository. The URL should lead to a valid GitHub repository.
Java source to collect the data used
The Java source code used to collect the data used in our study through the GitHub API is available in the “data_collector” directory. This source also requires the usage of Java 8. To run it, edit the utils.Config class and change the username and password information to your own. Also, edit the utils.LocalPaths class and change the path you want to save the data and CURL path. If you are a LINUX/MAC user, just change it to “curl”. If you are a WINDOWS user, put your CURL directory in the path.
Java source to compute the metrics
The Java source code used to compute the metrics is integrated in the code available in the “data_collector” directory. This source requires the usage of Java 8.
R source to perform the statistical analyses
The R source code to perform the statistical analyses is available in the “analysis” directory. This directory contain three scripts: logistic_regression_analysis.R, logistic_regression_utils.R, and wilcoxon_analysis.R. While the first and second scripts perform the multiple logistic regression analysis (RQ2), the third script performs the Wilcoxon and Cliff’s Delta (RQ1) analyses.
Before running, please: (i) install the required packages from CRAN; and (ii) change the paths to the input files. Then, to run the analyses, do:
Rscript logistic_regression_analysis.R
Rscript wilcoxon_analysis.R